
The lithium derivatives landscape: realities and prospects
For much of 2025, Li prices were languishing near US$10,000/t – a stark contrast to previous years when Li prices were trading multiples above marginal cost. The end of 2025 however saw new volatility drivers enter the market: uncertain prospects for Chinese lepidolite mines, higher LFP cathode utilisation rates and a major demand pivot by western cellmakers. With volatility coming back to the Li market, where do things stand with ex-China Li pricing mechanisms and the growing interest in paper markets to manage price risk?
Growing maturity
Unlike other markets that have attained pricing maturity over many years (e.g. the financialisation of the Brent complex in oil markets; the evolution of a liquid LNG spot market or the development of iron ore futures), lithium’s (Li) pricing journey has only just begun.
Several important features distinguish the Li pricing landscape, key among them being:
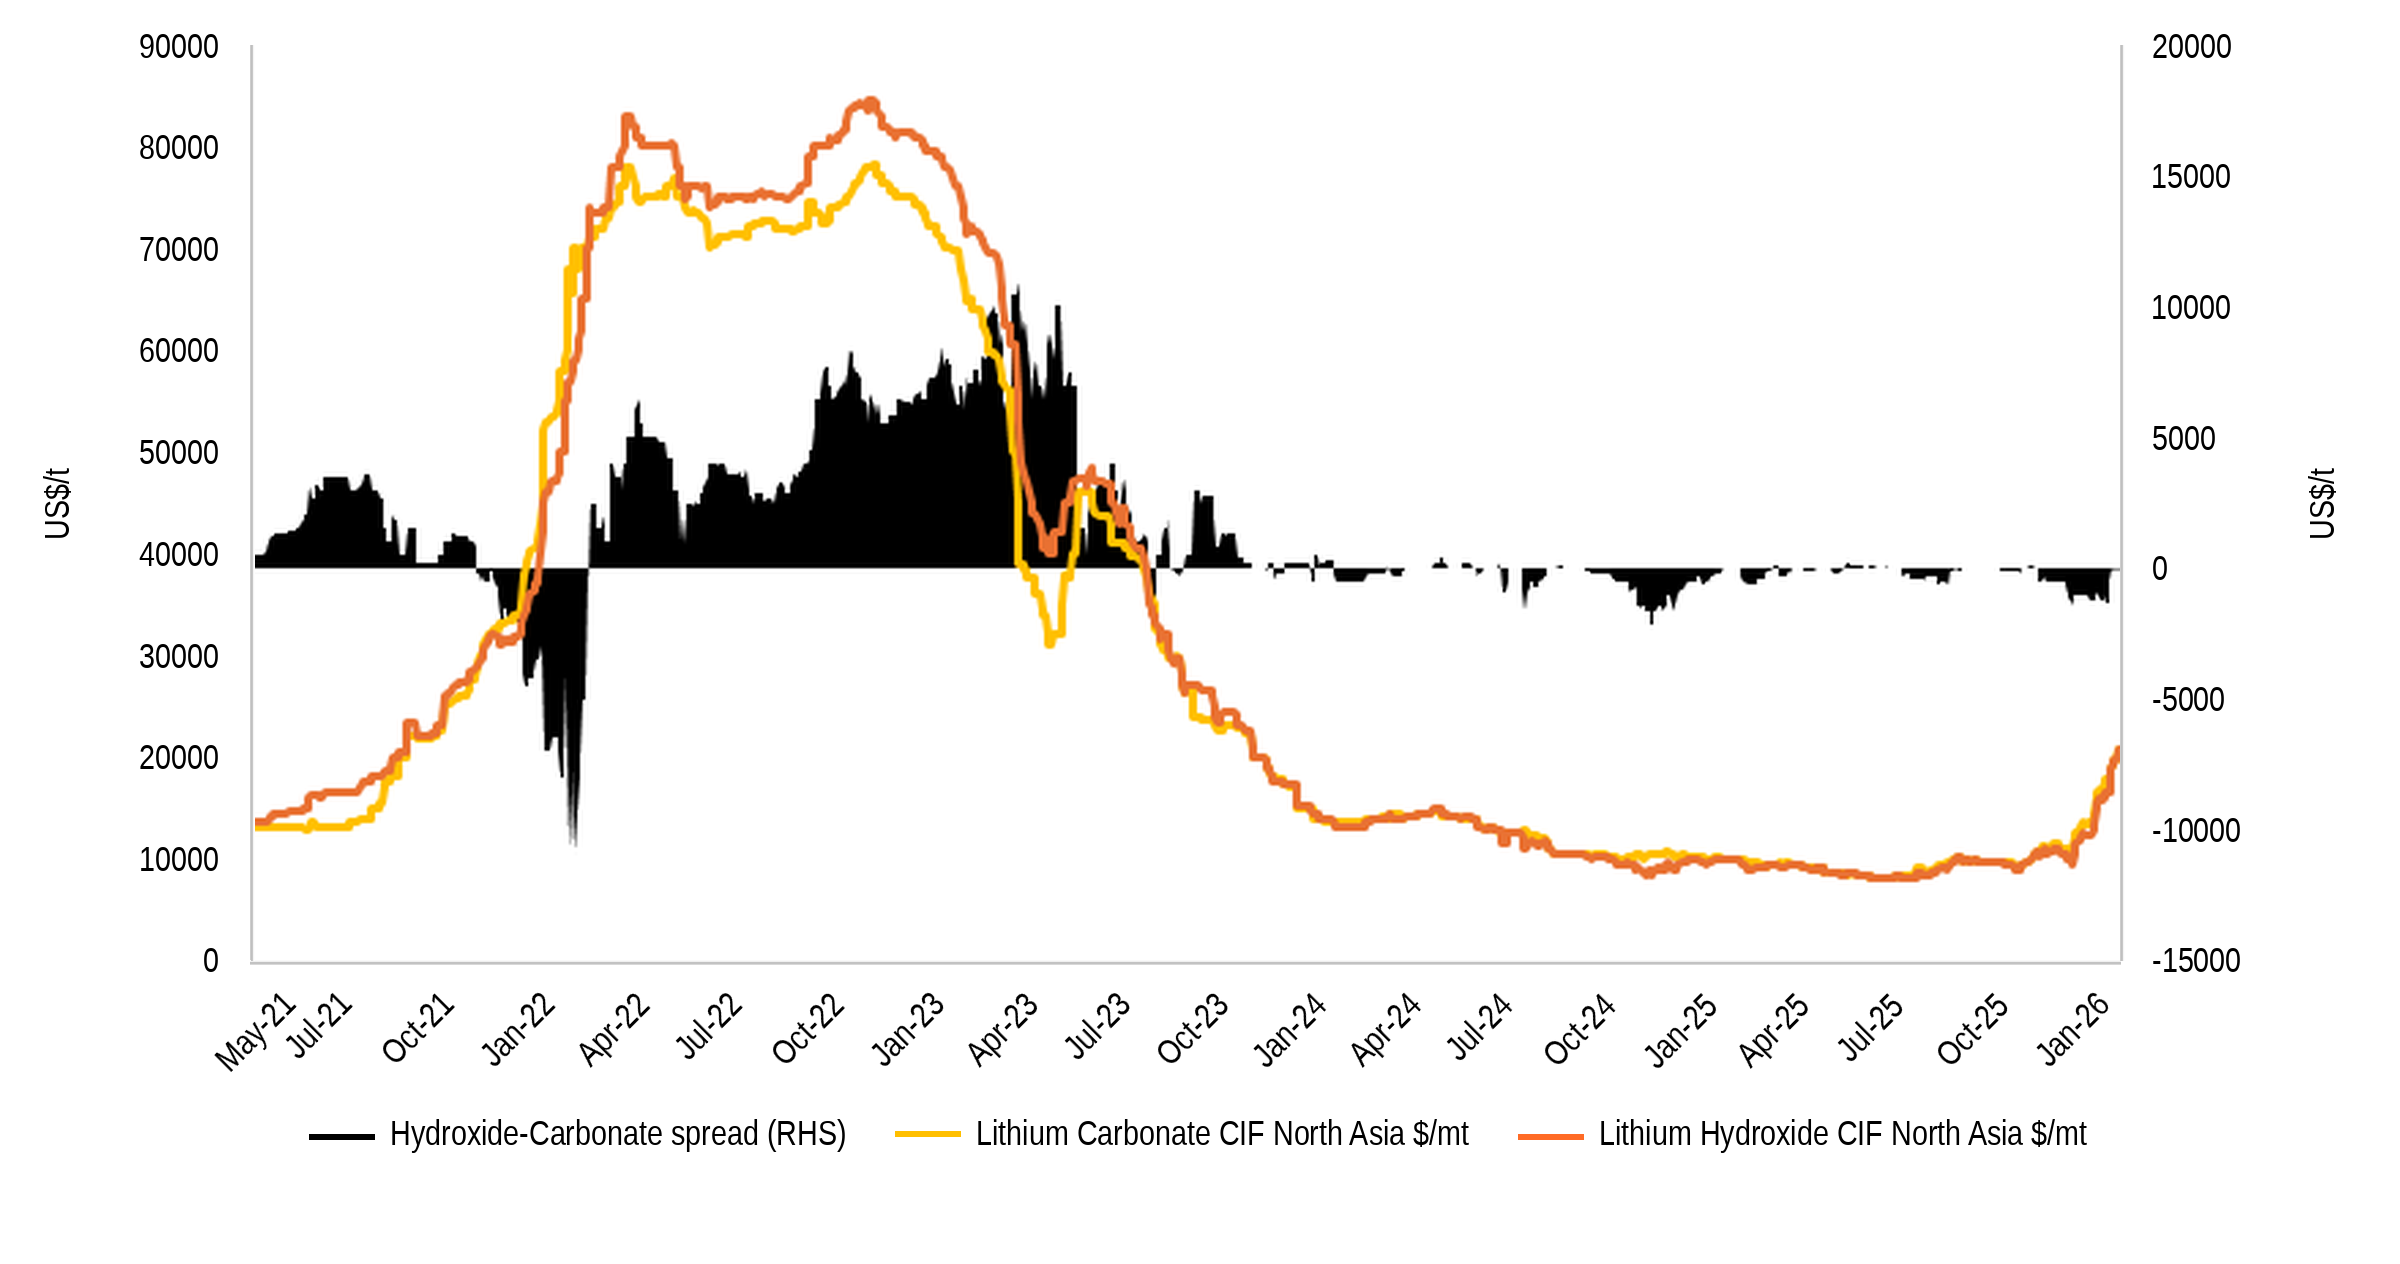
- The role of product quality: Li’s value chain is deep and include a range of products (e.g. battery-grade carbonate and hydroxide as well as technical-grade products used in the lubricants and glass industry. Lesser-known products ripe for price discovery include Li sulphate). Lithium hydroxide – more geared for Nickel-bearing cathode formulations – has typically commanded a premium over Li carbonate due to the cost of converting carbonate to hydroxide. Over the past several years, spreads between the two have been volatile but since 2023, spreads have stabilised as the high carbonate spot price lured marginal supply into the market, notably lepidolite from Chinese mines. The stabilisation has also been anchored by inventory management, greater maturity across procurement channels and the increased efficiency of Chinese Li refineries to switch more easily between carbonate and hydroxide production lines.
Carbonate v Hydroxide spread (US$/t) and spread (RHS)
- Contract v spot pricing: historically, volumes in the Li market were dominated by long-term contracts with fixed-price components (i.e. bilateral deals set to define a pricing level), largely insulating players from spot volatility. This reflected the immaturity of the industry. Fixed price deals guaranteed stable cash flows and was a means to securing financing, particularly for junior miners. Adjustments to the contract price (otherwise known as Quotation Periods, QPs) typically took place on a quarterly or semi-annual basis. In some cases, QPs could be even longer. In this sense, the average selling price (ASP) of some players during this period (2015-21) could be quite sticky and lag developments in the spot market. Typically, the contract price reference has been based on deals reported in the South Korean and Japanese markets – buyers of seaborne lithium (otherwise known as the Li carbonate CIF Asia price) – upon which EU and North American CIF swap prices largely track. The spot price meanwhile has typically been determined by transactions in China, largely a function of its outsized role in the value chain. China represents around ~80-85% of global cathode capacity, where contracts are much shorter, allowing for greater spot liquidity and procurement channels. Given this liquidity concentration, Chinese buying of Li (above and beyond contracted volumes) has been seen as the industry bellwether for spot pricing.
- The emergence of dynamic pricing: the surge in the Li spot price in 2022 however led to a shift in mechanisms. Spreads between Asian contract and spot prices blew out and attention focused on how ASPs could capture Li’s status as a seller’s market, with prices being more market-led. For established players with a competitive position in the cost curve, dynamic pricing also made sense as it allowed for greater upside, improved corporate valuations and higher dividends. As a result, QPs were shortened from quarterly to monthly and the contract price moved from a fixed to variable basis with a greater share of contracts moving to indexed-linked pricing, assessed by Price Reporting Agencies (PRAs). The development of more frequent reporting of spot prices from fortnightly to weekly to reflect greater spot volumes also helped with this trend. As of end 2025, ex-China physical Li supply contracts now typically reference the Fastmarkets CIF Asia Li price (or a basket of PRAs). Another way of showing the shift to more dynamic pricing can be seen in Albemarle’s pricing mix which have moved to greater indexed referenced, variable priced contracts. In 2025, around 50% of ALB’s volumes were sold on a variable pricing basis, with contract durations much shorter than historical volumes (2-3 years versus 5-6 years in 2022).
- Role of floor and ceiling prices: While Li pricing since 2022 has become more dynamic in the chemicals market, several factors prevent a full exposure to spot volatility, namely:
- Price floors: these come to the rescue of players during spot price meltdowns. Price floors vary across the industry but are typically based on an understanding of long-run marginal costs/incentive prices.
- Exotic formulas: a trend in the past year has been to include more exotic formulas in floor price formulas. For example, once the PRA price moves above the floor price, the pricing model moves to a revenue share split. For example, a seller can offer a 15% discount on PRA contract index when the index goes above US$20/kt and up to US$30/kt for example. The 15% discount would only apply on values above US$20/kt, e.g. if index is US$25/kt, seller offers 10% discount on US$20/kt and 15% on US$5/kt. The discount increases incrementally as the price moves above different ranges.
- Price ceilings: these are governed by bilateral negotiations between buyer and seller which also include discounts and other factors to dampen volatility risks.
In many ways, the lithium market’s move to dynamic pricing continues to evolve and is the first chapter in the industry’s road to market maturity. However, it has also exposed the value chain to greater spot volatility creating a dynamic tension with efforts to build out the value chain outside China, impacting Net Present Value (NPV) sensitivity for greenfield projects and the hurdle rate for new entrants.
Derivatives and price risk management
This has raised questions as to whether Li derivatives can play a greater role across the value chain in price risk management. The past several years has seen major interest in Li derivatives. Exchange-based Li contracts now exist across a host of exchanges, including the Chicago Mercantile Exchange (CME), Intercontinental Exchange (ICE), London Metals Exchange (LME) and Singapore.
While China hosts the world’s largest physically deliverable contract (GFEX Li carbonate), ex-China contracts largely remain cash settled. Why is this?
Certainly, industry leaders such as Albemarle have flirted with the idea of supporting physically backed Li pricing contracts, enthusiasm may not be industry wide. SQM – the largest supplier of Li carbonate outside China – may have reservations over the legal risks associated with Transfer of Title (ToT). Under Chile’s Nuclear Non-Proliferation obligations, lithium is a strategic material requiring strict end-user vetting for every export permit. Delivering to an anonymous exchange warehouse breaks the ‘chain of custody’ making it legally impossible for SQM to certify the final recipient to the Chilean Nuclear Energy Commission (CCHEN). Second, SQM operates on a marginal royalty tax system with the government. As the price of carbonate goes up, so does the marginal tax rate. Crucially, for royalty calculation and auditing purposes, the Chilean government requires precise information on the identity of the end client and destination of the material to verify the reported sale value and prevent tax leakage.
So, where does Li’s foray into the paper market stand as of today? What does the ex-China derivatives landscape tell us about the Western Li value chain?
The CME’s performance is illustrative here given its head start on launching cash-settled contracts. While ICE launched a suite of cash-settled contracts in 2025, trading volume has been negligible so far.
Open Interest (OI) on CME’s Li Hydroxide shows that liquidity only really began to develop from 2023 onward, the period when Li prices hit all-time highs, forcing companies to seek hedging mechanisms to survive volatility. As shown below, OI peaked in late 2024 and early 2025 – a reflection of greater swap dealer participation.
CME Li carbonate and hydroxide futures OI (lots)
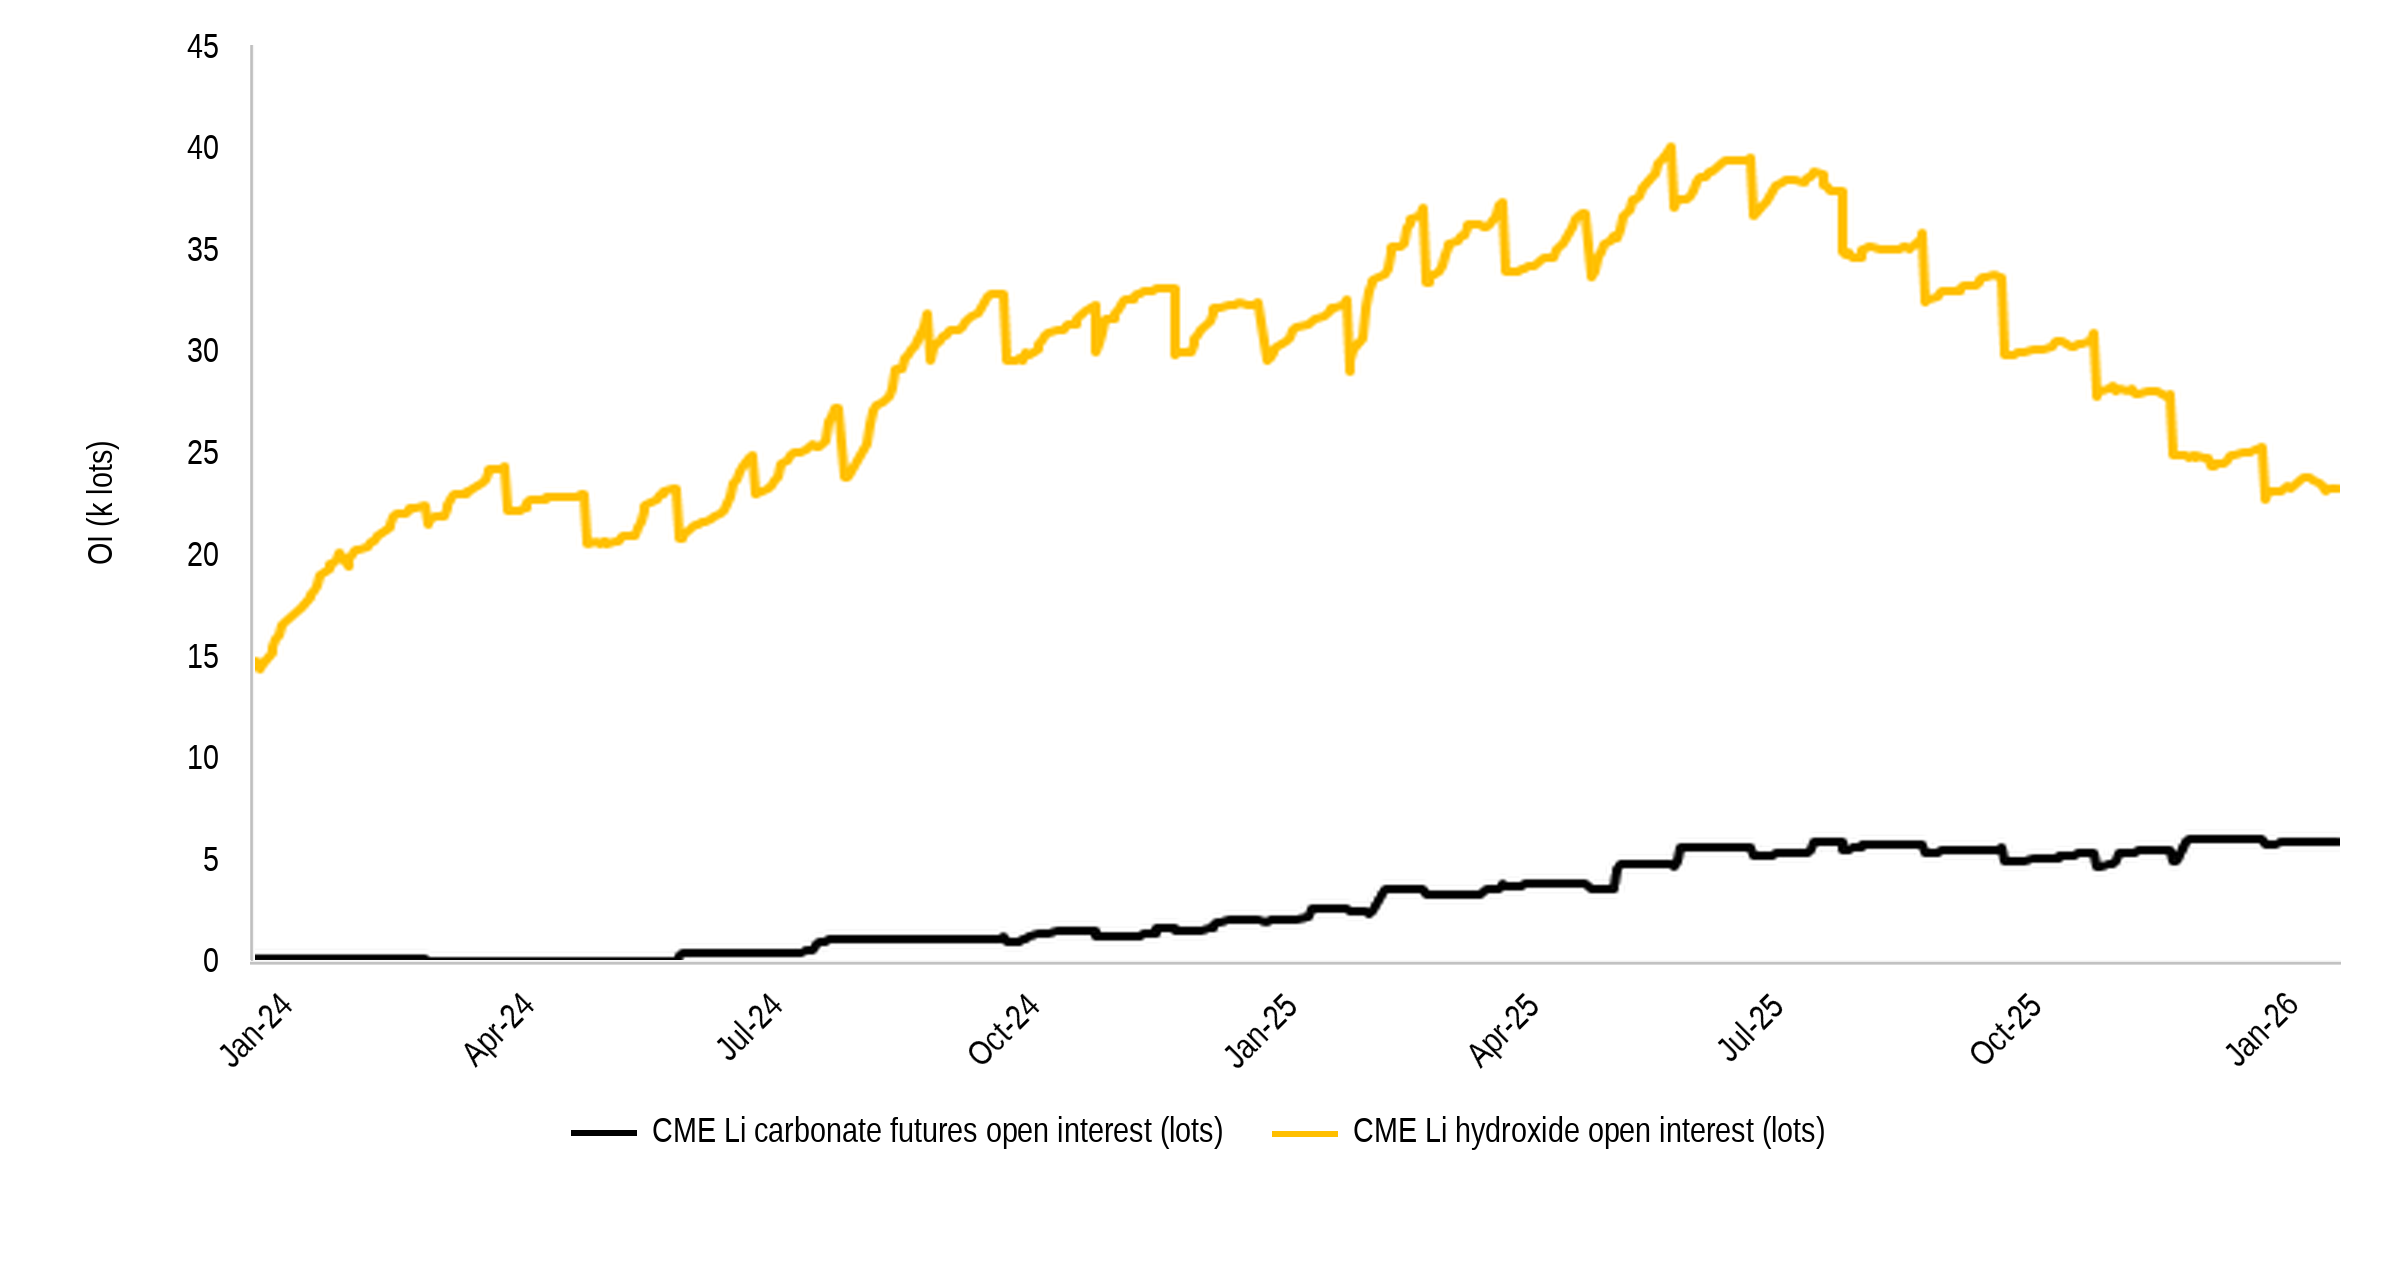
Interestingly, open interest is more than 5x on the hydroxide contract v carbonate. This reflects both the immaturity of the LFP value chain ex-China and the western preference for hydroxide used in NCM cells for western EV markets. Over time however, carbonate volume should grow as key markets such as the US and EU build out LFP cathode capacity – a trend supported by the pivot of ex-China cellmakers to LFP cells to meet surging demand for battery energy storage systems (BESS).
Who is who in the CME contracts?
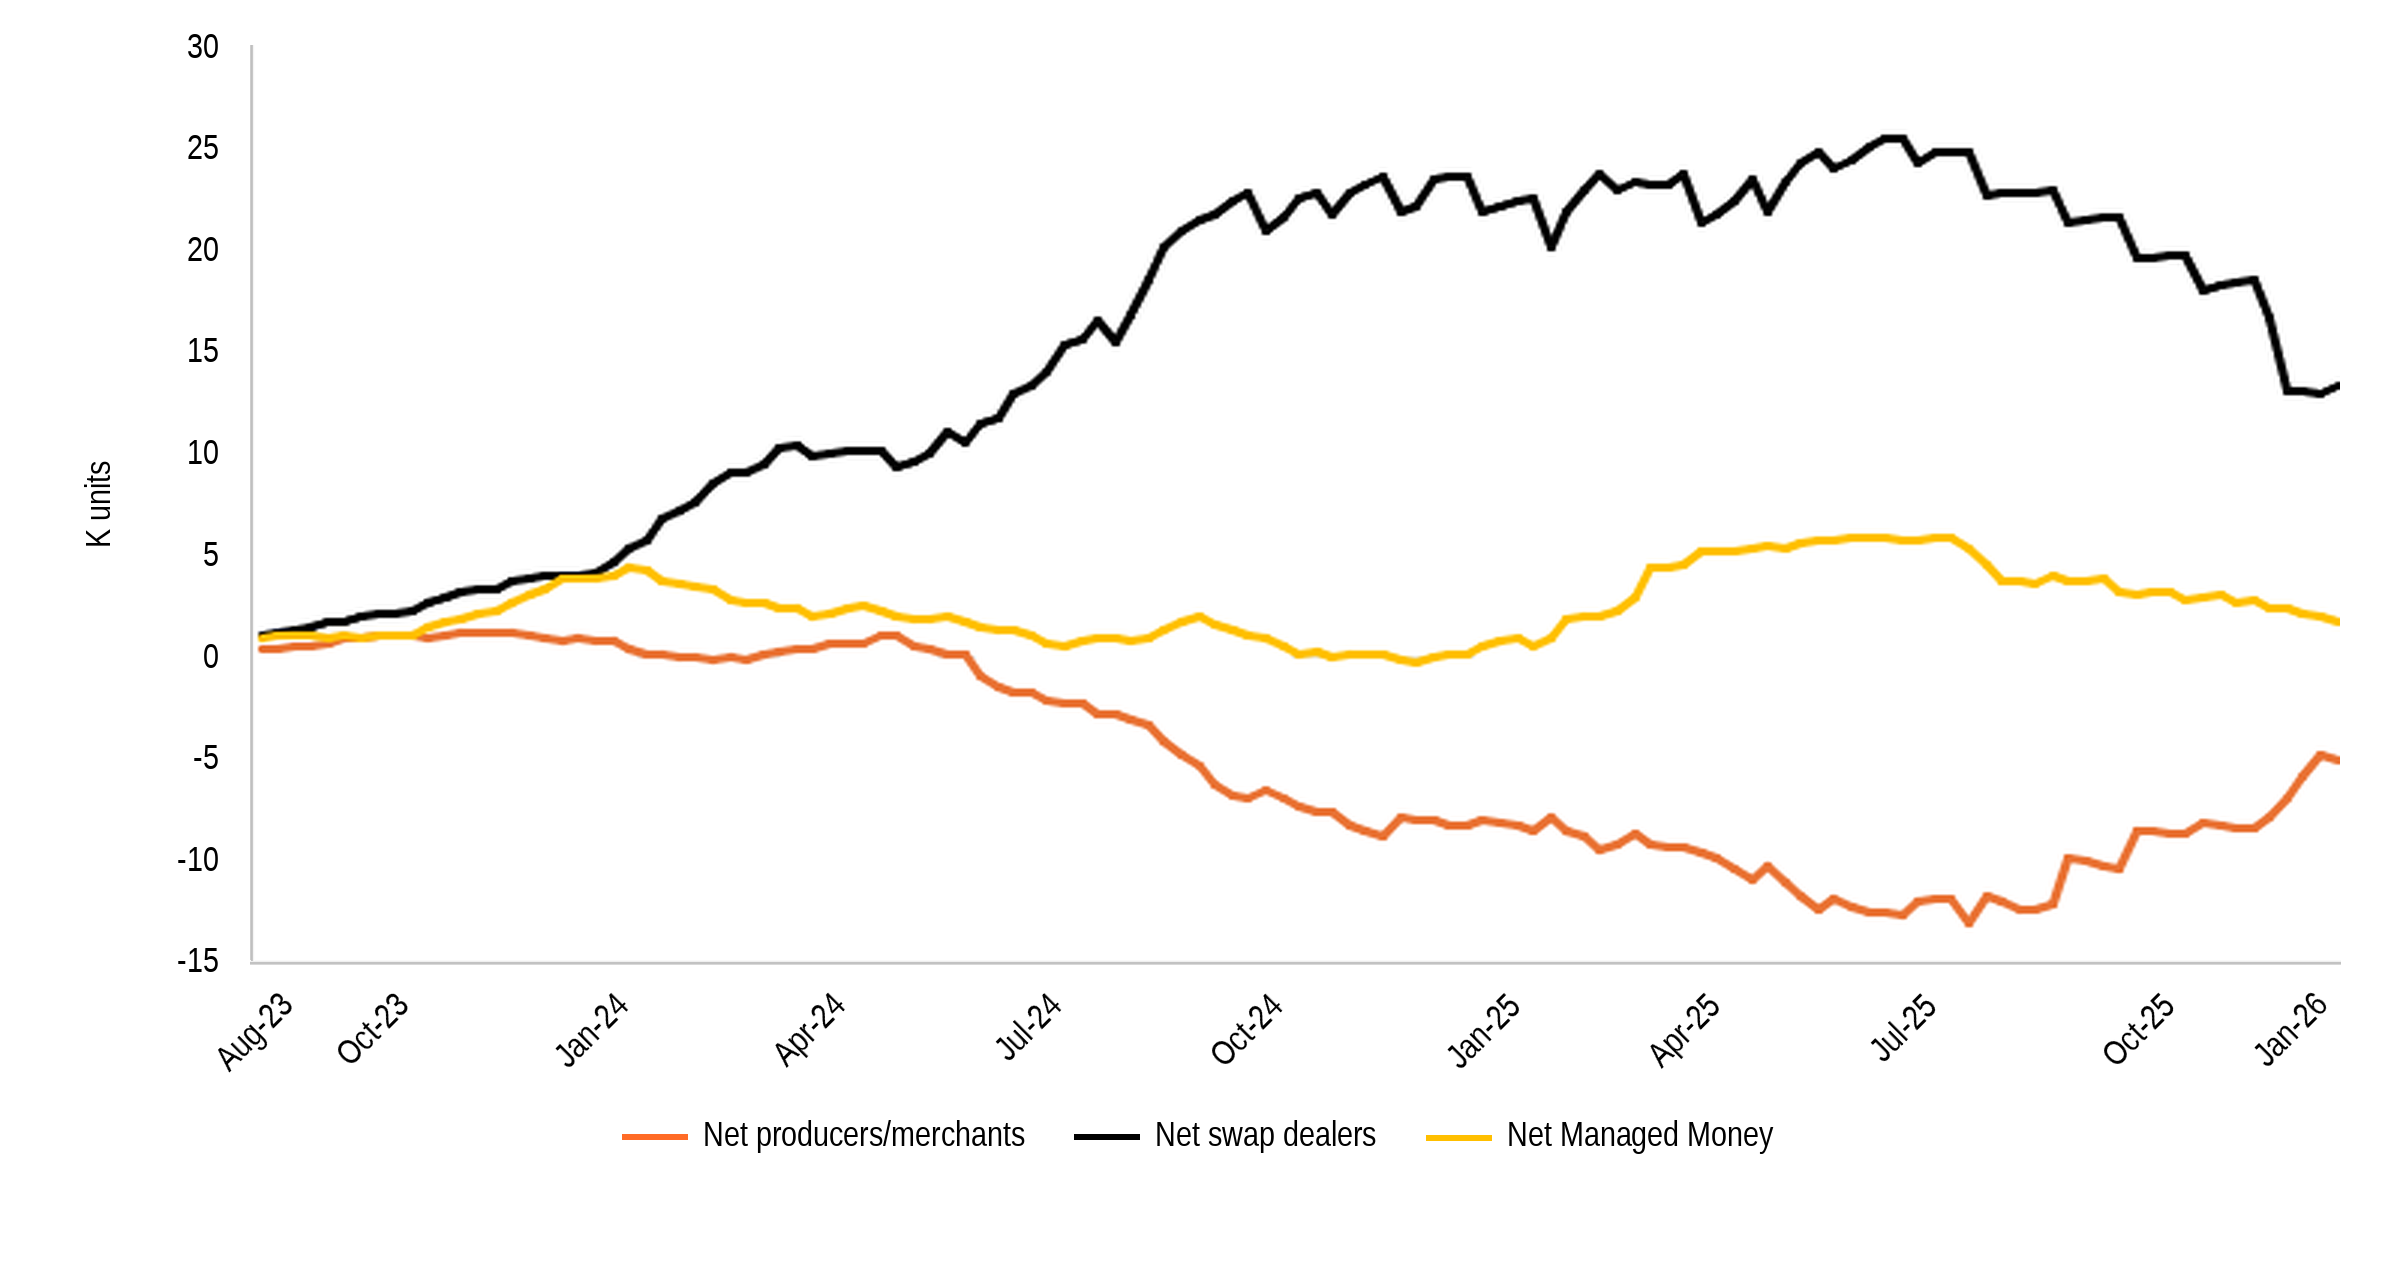
- Swap dealers dominate OI across CME’s Li contracts. Banks such as Macquarie act as key players in the Li contract, typically acting on behalf of OEMs (swap dealers hold around 65% long positions).
- Li producers are also active in using cash-settled hydroxide, an important consideration given most Li hydroxide physical contracts used in ex-China markets for example are settled using Fastmarkets CIF Asia pricing (also used to settle CME’s paper contracts). We would assume that basis risk was the key consideration here, particularly aversion to “dirty hedges” where a derivative contract should be matched against the underlying physical price assessment.
Net positions by player category (Lithium hydroxide)
What else can be said about how OEMs are using CME cash contracts?
- Hedging the strip: some OEMs in Europe and US with cap and collar physical contracts see value in “hedging the strip” of the CME cash contract. With strip values ranging from US$10-20,000/t in some contracts, treasury teams at OEMs are using swap dealers to lock in a single fixed price for the next 12 months. This turns the “strip” between floor and cap into a fixed price, providing greater certainty.
- Collar hedging: given the large range between price floors and caps in contracts between Li producers and OEMs, we have seen OEMs increasingly use collar hedging techniques. In one contract we have seen for example between a European DLE Li producer and European OEM, the difference between floor and cap is around US$15,000/t. If the Fastmarkets physical price is trading near the floor, an OEM would seek to hedge the difference between the floor and cap, ensuring any physical move up toward the cap is protected in the cash market.
What does CME OI tell us about the structure of the Li market? To answer this, we need to understand the reality of physical Li flows.
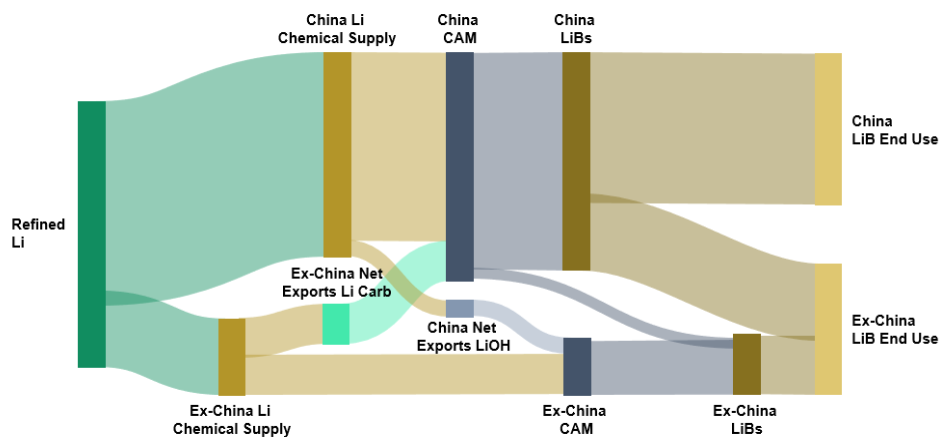
The figure below captures the divisions and inter-relationships that existed between the China and ex-China lithium chemical supply chains in 2025.
2025 Li physical flows (t LCE)
What do the physical flows tell us?
- China was a net importer of lithium chemical due to the lithium carbonate volumes it buys from Chile and Argentina. That carbonate supported China’s expansion in LFP CAM production.
- China was a net exporter of lithium hydroxide to the ex-China market, which reflects the incumbency of high-nickel CAM technology there. Based on physical seaborne flows from China to Korea/Japan, the CME has anchored its role as the primary tool for hydroxide hedging. Why isn’t the ratio of physical to paper larger? We think the answer rests with the fact that some Korean cathode producers (e.g. Ecopro, LG) don’t carry price risk as they use pass through contracts. This largely explains why swap positions held on the CME contract are mostly “longs” held by OEMs or cellmakers.
- Net CAM flows between China and ex-China were relatively modest. In contrast, China net exports of LiB cells were substantial. Almost a third of China’s LiB output was exported to the ex-China market in 2025, either directly or incorporated in some finished product, such as an EV. This reinforces our point around China exporting cells and EVs to the West risks cannibalising ex-China carbonate hedging demand.
What are the implications?
- Firstly, the net exports of lithium carbonate to China effectively reduce hedgeable volumes that are left for processing and onward consumption in the ex-China market. For this to change, there would need to be a build out of LFP CAM capacity outside of China in coming years.
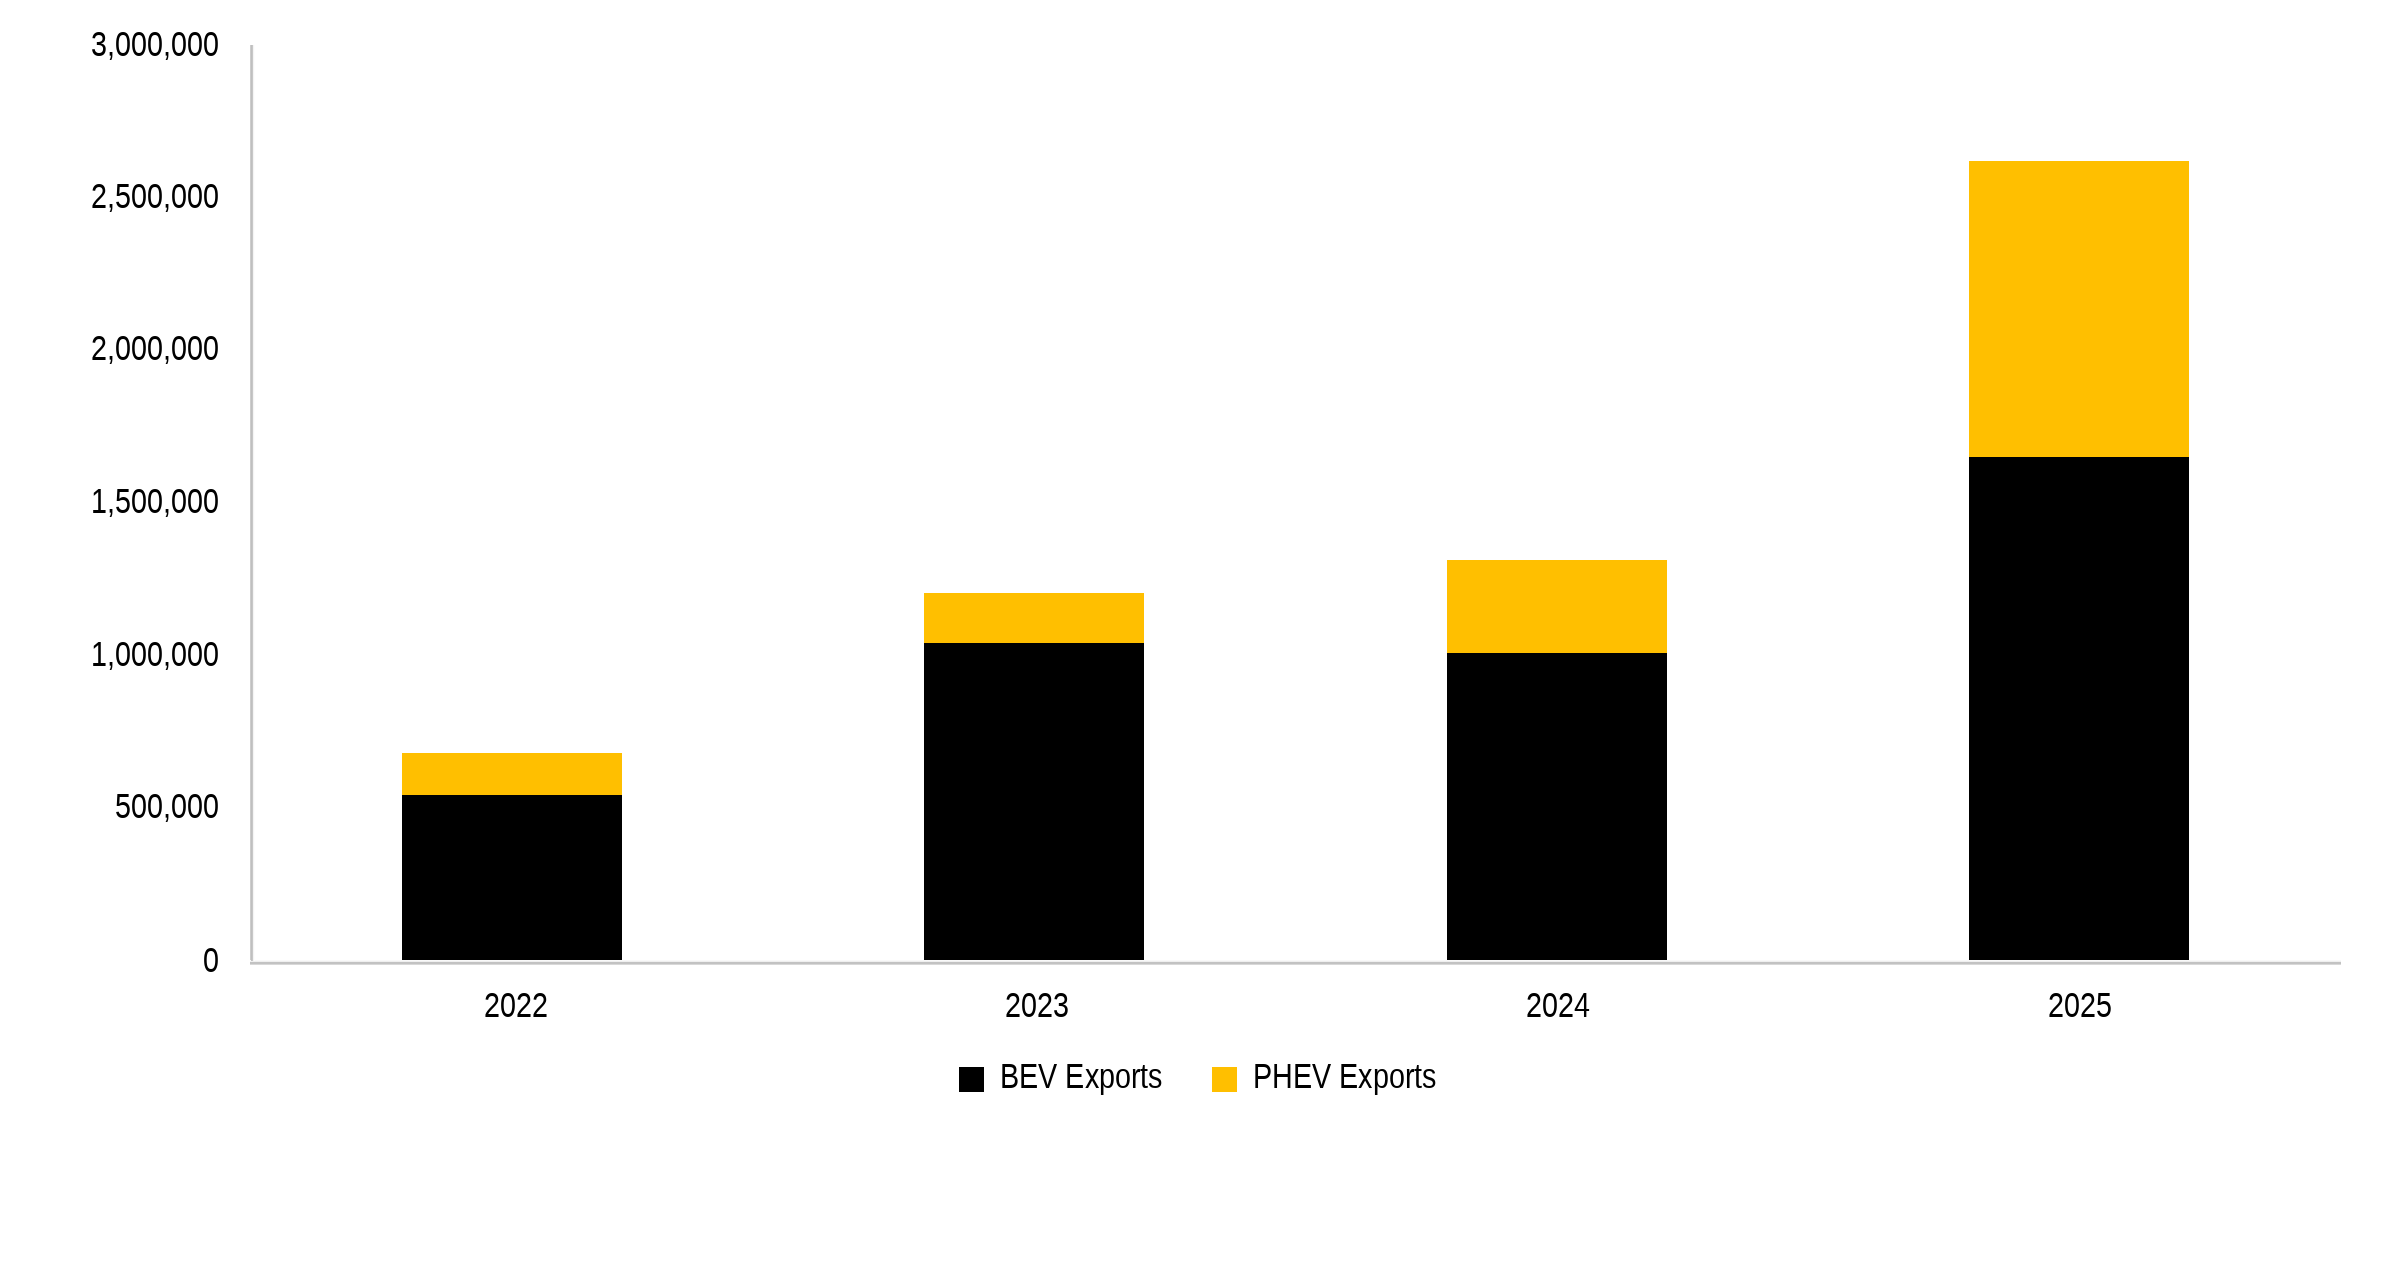
- Secondly, if China’s EV exports continue to rise that will also reduce the “pool” of hedgeable lithium carbonate volumes circulating in ex-China markets. Chinese EVs have faced trade barriers in some markets—the USA, for example—that have acted like a de facto ban. However, Chinese OEMs have also navigated around BEV tariffs in the EU prioritising PHEV sales over the last year or so. As a result of this, as well as sales to other emerging markets around the world, China more than tripled its EV exports between 2022 and 2025.
Chinese EV exports surged in 2025 as the country’s OEMs targeted overseas markets
Keen to dig deeper? Stay ahead of the market with REA
Related Insights
- Batteries
The LGES/Lopal deal highlights the urgency with which US LiB makers feel they must respond to fast rising demand for ESS cells. They cannot wait...
- Batteries
While Section 45X manufacturing credits and surging data-centre storage demand have successfully catalysed U.S. LFP cell manufacturing, the domestic supply chain faces a critical midstream...
- Batteries
In late February, Zimbabwe suspended exports of lithium concentrates in a bid to strengthen its domestic Li value chain and curb illegal shipments. What are...